After running the Vegetation Dam Capacity Model, you can run the Combined Dam Capacity Model tool. This fuzzy inference system model predicts the maximum number of dams each reach could support based on 4 inputs: 1) the output of the vegetation dam capacity model 2) the low (base) flow stream power, 3) the high flow (Q2) stream power, and 4) the slope of the reach. The model predicts dam capacity separately for historic vegetation dam capacity and existing vegetation dam capacity.
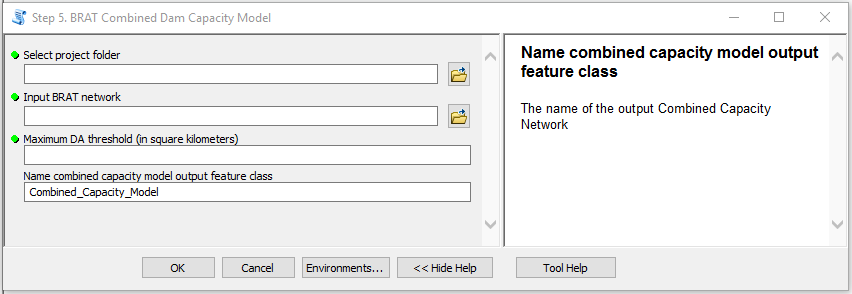
Figure 1: BRAT Combined Capacity Model tool interface.
Inputs and Parameters:
- Select Project Folder - path to the BRAT project folder
- Input BRAT Network - select the BRAT network that you have been using up to this point
- Maximum DA Threshold - this is a drainage area value above which it is assumed that the stream is too large for beaver to build dams on. This varies from region to region and should be adjusted according to the hydrologic characteristics of the study area.
- Save Output Network - choose a location and name to save the output
The output network will be placed in a new folder in Output_## called 02_Analyses. The output network will have the new fields oCC_HPE (historic dam capacity density), oCC_EX (existing dam capacity density), mCC_EX_Ct (existing dam capacity count), and mCC_HPE_Ct (historic dam capacity count).
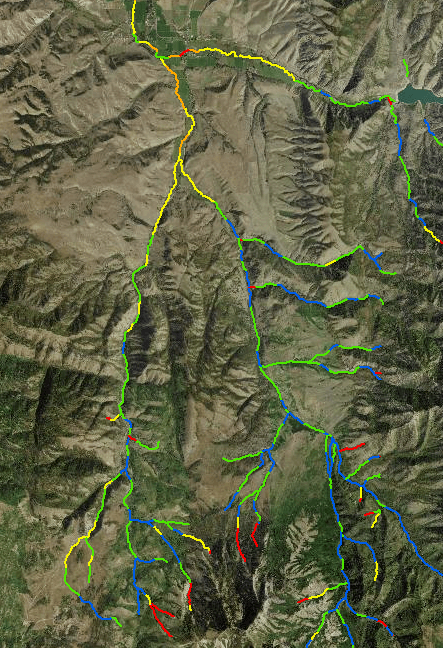
The fields oCC_HPE and oCC_EX are split into the following categories for our symbology:
- None: 0 dams
- Rare: 0-1 dams/km
- Occasional: 1-5 dams/km
- Frequent 5-15 dams/km
- Pervasive: 15-40 dams/km
Layers are created with these symbologies in the folder 01_Capacity, which is placed in 02_Analyses.
 Back to BRAT Home