Purpose
This document explains our most recent standards on displaying the summary of BRAT outputs through charts.
Procedure
Part of creating stand alone figures for the BRAT outputs is creating charts and tables that are added to the maps for further descriptions and comprehension for the client. A description of working with Microsoft Excel to produce the charts and creating common effect that are used in the Summary Products. Summing up the products which are necessary for the summary products for the BRAT projects produced by the Ecogeomorphology and Topographical Analysis Lab at Utah State University.
Examples
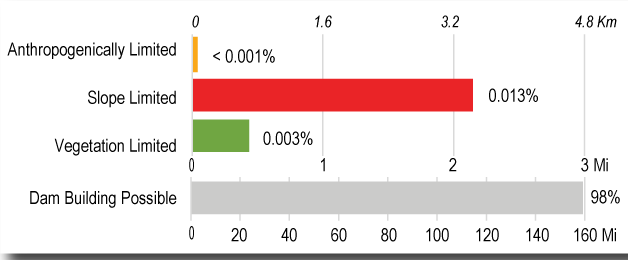
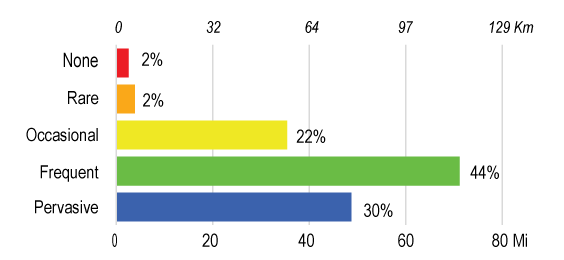
Capacity Charts
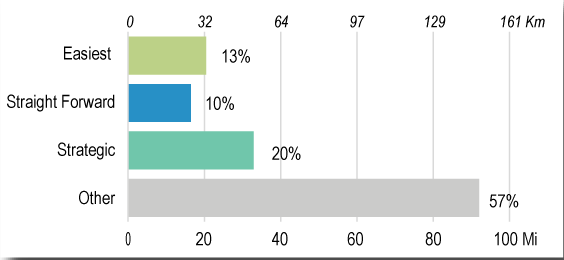
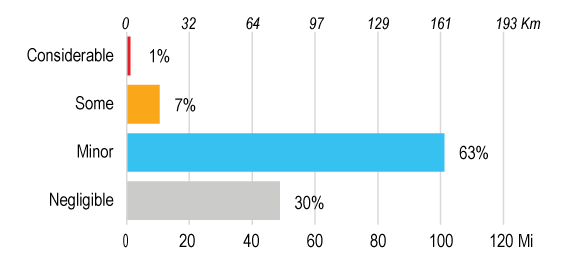
Management Charts