Purpose of the Collect Summary Products tool
The Collect Summary Products tool is meant to be run after all other tools in the BRAT toolbox have been completed. An Excel document is created that contains useful summary statistics, looking at a large variety of data created using BRAT. The tool can summarize BRAT run on a single watershed or combine BRAT outputs from multiple watershed into a single summary. Using this tool is optional but can be very useful to get an overview of a BRAT model run and spot any potential errors.
Running the Collect Summary Products tool
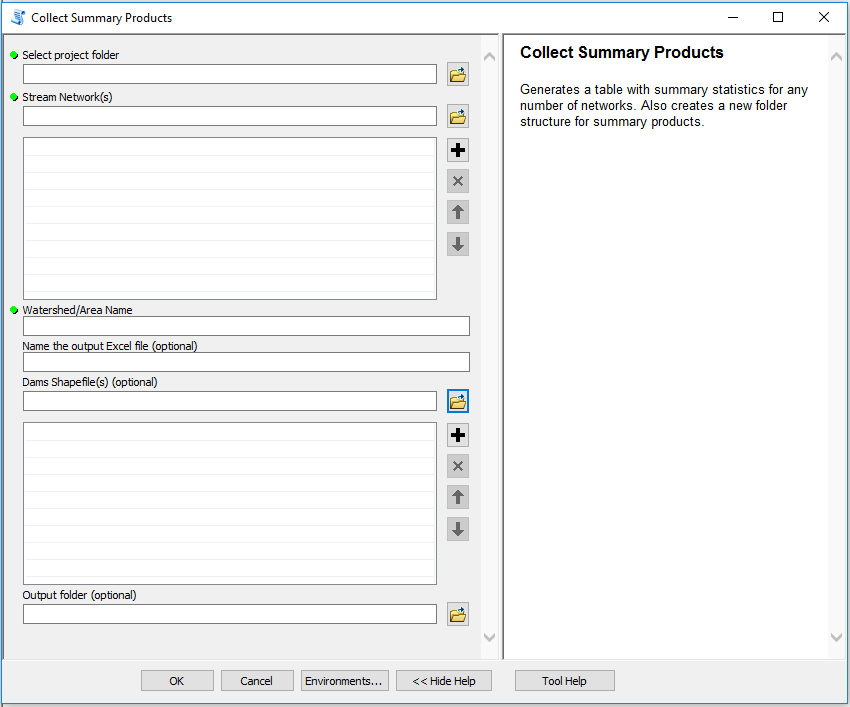
Figure 1: BRAT Collect Summary Products tool interface.
The required inputs for the Collect Summary Products tool include:
- Project Folder: The BRAT project folder.
- Stream Network(s): The stream network containing all data generated by BRAT. This should be the last network generated from your BRAT run (i.e., the Data validation output, conservation restoration output, or combined capacity output). The tool is most useful given output from a higher level of BRAT (i.e., the conservation restoration model or data validation outputs). If multiple shapefiles are given, this tool will internally merge them and treat them as one large network.
- Watershed/Area Name (optional): The name of the area or watershed you want summarized, used to label output Excel sheets.
- Output File Name (optional): The name of the output Excel document. This value will default to “BRAT_Summary_Tables” if left blank.
- Dams Shapefile(s) (optional): The surveyed beaver dam locations used in the data validation tool.
- Output Folder (optional): This is the folder where the Excel file will be saved. As default, the file will be saved within the BRAT project’s summary products folder.
Output Summary Sheets
The output Excel file will include a sheet for each of the following, given that the field these sheets are based on was present in the input stream network(s):
- Watershed Summary: An overview of statistics for the entire area.
- Density Correlations: This sheet looks at how high and low stream flow, high and low stream power, and stream slope correlate with dam density. Each field is split into three bins with an equal amount of reaches. This is a quick way to tell what hydrologic factors may be influencing existing dam density.
- Existing Dam Building Capacity: Overall stream length and proportion of reaches classified as pervasive, frequent, occasional, rare, or none based on the existing dam building capacity
oCC_EX. - Existing Dam Complex Size: Overall stream length and proportion of reaches classified as large complex, medium complex, small complex, single dam, or no dams based on the existing dam complex size
mCC_EX_CT. - Historic Dam Building Capacity: Overall stream length and proportion of reaches classified as pervasive, frequent, occasional, rare, or none based on the historic dam building capacity
oCC_HPE. - Historic Dam Complex Size: Overall stream length and proportion of reaches classified as large complex, medium complex, small complex, single dam, or no dams based on the historic dam complex size
mCC_HPE_CT. - Existing vs. Historic Capacity: A comparison of existing and historic dam capacity based on capacity category (e.g., pervasive, frequent, occasional, rare, none). Estimated existing dam capacity, historic dam capacity, and percent loss are calculated for each category.
- Conservation Restoration: Overall stream length and proportion of reaches classified as into the conservation restoration categories based on the
oPBRC_CRfield from the conservation restoration tool. - Unsuitable or Limited: Overall stream length and proportion of reaches classified as into the unsuitable/limited opportunities categories based on the
oPBRC_UDfield from the conservation restoration tool. - Undesirable Dams: Overall stream length and proportion of reaches classified as into the risk of undesirable dams categories based on the
oPBRC_UIfield from the conservation restoration tool. - Management Strategies: Overall stream length and proportion of reaches classified as into the current beaver dam management categories based on the
ConsVRestfield from the data validation tool. - % Historic Capacity Remaining: Overall stream length and proportion of reaches binned into categories of 25% based on the
mCC_EXvHPEfield from the data validation tool. - Strategy Map: Overall stream length and proportion of reaches classified as into the beaver dam management strategy categories based on the
DamStratfield from the conservation restoration tool. - Predicted vs. Surveyed: Comparison of BRAT accuracy by reach using the
BRATvSurvfield calculated in the data validation tool. These values are split across the major land use categories, which is useful to see what factors may be influencing accuracy. - Electivity Index: Comparison between BRAT existing capacity and surveyed dam density, with the proportion of the stream network length classified as pervasive, frequent, occasional, rare, or none calculated for each. The ratio of these values represents an electivity index, a measure of selection where values greater than 1 represent areas that are “preferred” and values less than 1 represent areas that are “avoided”. These values should increase from none to pervasive if the model is performing well.
 Back to BRAT Home
```
Back to BRAT Home
```