The majority of users of BRAT will not actually run BRAT themselves, but instead will download BRAT outputs and summary products for use in beaver-related stream conservation and restoration efforts. In the text and videos tutorials below, we walk through various ways to interact with the BRAT outputs. We cover each of the outputs that BRAT produces, provide lookup tables for investigative purposes, and provide illustrative videos to help access and interrogate the outputs.
The BRAT Default Legends
Capacity Layer
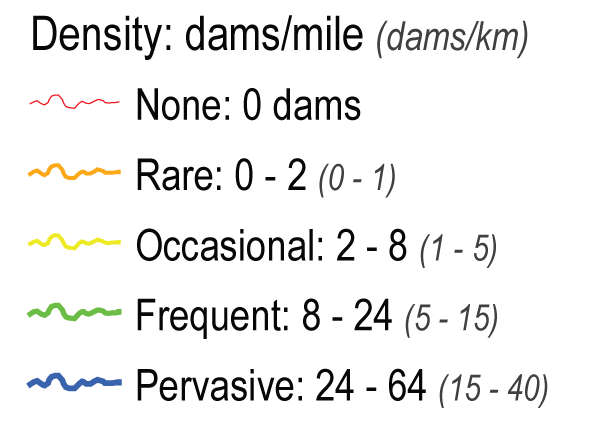
The capacity model outputs use the following color scheme to bin the output data (note each ≤300 m reach has a specific continuous dam density output). Existing capacity output is found in the OCC_EX field and historic capacity is found in the oCC_HPE field. These values represent modeled beaver dam capacity as dams per kilometer or mile of a particular segment within the stream network. The following color scheme is used to illustrate these outputs:
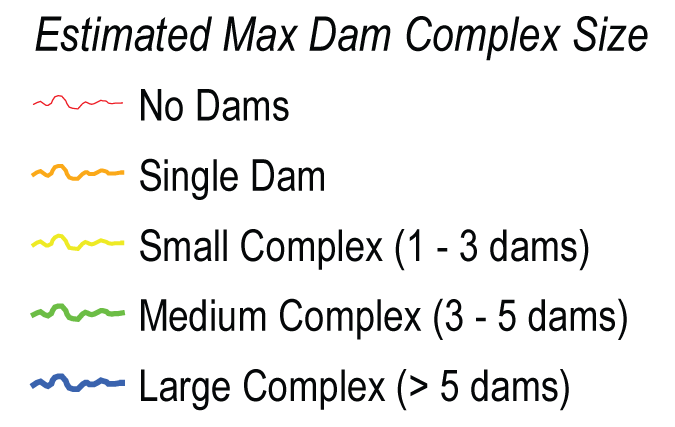
In addition, the capacity outputs and reach lengths were used to report estimated dam complex size mCC_EX_CT (for existing) and mCC_HPE_CT (for historic) fields. This is a modeled maximum number of the dams on that particular segment of the stream network. The following color scheme is used to illustrate these outputs:
Management Layers
The management output layers include outputs that describe the limiting factors which contribute to unsuitable or limited beaver dam opportunities (oPBC_UD), risk categories which are based on land use and anthropogenic proximity (oPBC_UI), and finally a measure of the effort exhibited to perform restoration or conservation in the segment (oPCRC_CR). For the (oPCRC_CR) output a sub-set of the segments classified as ‘Negligible Risk’ and ‘Minor Risk’ (oPBC_UI) is used to focus restoration or conservation efforts. Segments that are ‘Considerable Risk’ or ‘Some Risk’ (oPCRC_UI) are defined as ‘Other’ for (oPCRC_CR) field. Further documentation and discussion/development of these layers can be found here.
-
Unsuitable or Limited Beaver Dam Opportunities (
oPBRC_UD) identifies areas where beaver cannot build dams now, and also differentiates stream segments into anthropogenically and naturally limited areas. The following color scheme is used to illustrate these distinctions: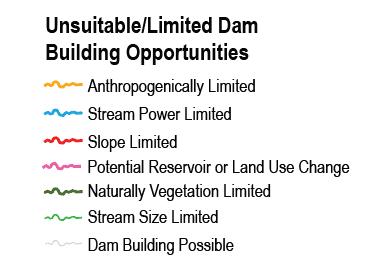
The field oPBRC_UD is calculated based on the following criteria:
- Dam Building Possible is for streams where historic vegetation is not a limiting factor (
oVC_HPE> 0), where slope is not a limiting factor (iGeo_Slope< 0.23), and where the model currently predicts dams can exist (oCC_EX> 0). - Anthropogenically Limited is for streams where historic vegetation is not a limiting factor (
oVC_HPE> 0), where slope is not a limiting factor (iGeo_Slope< 0.23), but where current vegetation is limiting beaver dam capacity (oVC_EX=oCC_EX= 0), presumably due to high levels of anthropogenic land use (iPC_LU> 0.3). - Stream Power Limited is for streams where historic vegetation is not a limiting factor (
oVC_HPE> 0), where slope is not a limiting factor (iGeo_Slope< 0.23), where current vegetation is not a limiting factor (oVC_EX> 0), and where the model predicts that the stream cannot currently support beaver dams (oCC_EX= 0) because stream power is too low (iHyd_SPLow<= 190) to support beaver dams or too high (iHyd_SP2>= 2400) for dams to survive flooding. - Slope Limited is for streams where historic vegetation is not a limiting factor (
oVC_HPE> 0), but where slope is a limiting factor (iGeo_Slope>= 0.23). - Naturally Vegetation Limited is for streams where both historic and existing vegetation are limiting factors (
oVC_HPE=oVC_EX= 0). - Potential Reservoir or Landuse Conversion is for the rare streams where historic vegetation is a limiting factor (
oVC_HPE= 0), but existing vegetation is not (oVC_EX> 0).
- Dam Building Possible is for streams where historic vegetation is not a limiting factor (
-
Potential Risk Areas (
oPBRC_UI) identifies riverscapes that are close to human infrastructure or high land use intensity and where the capacity model estimates that beavers can build dams. The layer/map is called ‘areas beavers can build dams, but could be undesirable’ and is divided into: “Major Risk”, “Considerable Risk”, “Minor Risk”, and “Negligible Risk”. The following color scheme is used to illustrate these distinctions: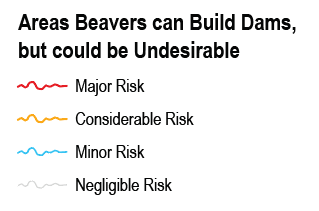
The field
oPBRC_UIis calculated based on the following criteria:- Major Risk is for streams where the model estimates that beaver dams are Pervasive or Frequent (
oCC_EX>= 5), and yet the land is highly used (iPC_LU>= 0.66) or the stream is within 30 meters of some form of infrastructure, whether that is roads, canals, or railroads (oPC_Dist<= 30). - Considerable Risk is for streams where the model estimates that beaver dams are Occasional or Rare (1 <=
oCC_EX<= 5) but the land is highly used (iPC_LU>= 0.66) or the stream is within 30 meters of some form of infrastructure, whether that’s roads, canals, or railroads (oPC_Dist<= 30); OR where the model estimates that beaver dams are Frequent or Pervasive ('oCC_EX>= 5) and the stream is within 100 meters of some form of infrastructure (30 <oPC_Dist<= 100). - Minor Risk is for streams where the model estimates that beaver dam capacity is Occasional or Rare (1 <=
oCC_EX<= 5) and the stream is within 100 meters of some form of infrastructure (roads, canals, or railroads, 30 <oPC_Dist<= 100); OR where the model predicts that the stream can support dams (oCC_EX> 0) and the land is moderately used (0.33 <=iPC_LU<= 0.66) or the stream is within 300 meters of some form of infrastructure (100 <oPC_Dist<= 300). - Negligible Risk is for a stream where the model predicts that the stream cannot currently support beaver dams (
oCC_EX= 0), or a stream where the model predicts that dams can currently exist (oCC_EX> 0) but does not fall into the above categories.
- Major Risk is for streams where the model estimates that beaver dams are Pervasive or Frequent (
-
Dam-building beaver restoration opportunities (
oPCRC_CR) identifies levels of effort required for establishing beaver dams on the landscape. Previously known as the Conservation and Restoration Opportunities layer. and restoration. This management output consists of the following categories: i) ‘easiest - low hanging fruit’ has capacity, just needs beaver if beaver are not there yet, ii) ‘straight forward - quick return’ is currently occasional capacity but historically was higher capacity, iii) ‘strategic’ is currently degraded condition with historically higher capacity. These areas typically need long-term riparian recovery before beaver can be introduced (e.g. grazing management), and 4) ‘other’ is for streams that do not fall into the above categories. Such areas are primarily streams classified as “Considerable Risk” or “Some Risk” inoPBRC_UIthough there are exceptions to that. The following color scheme is used to illustrate these distinctions: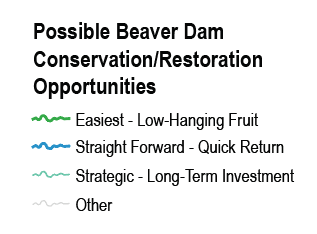
The field
oPCRC_CRis calculated based on the following criteria:- Easiest - Low-Hanging Fruit is for streams that have been classified as “Negligible Risk” or “Minor Risk” in
oPBRC_UI, and where the model estimates dams are already at least Occasional (oCC_EX>= 5) and where the departure from historic conditions is at most three dams (mCC_HisDep<= 3). - Straight Forward - Quick Return is for streams that have been classified as “Negligible Risk” or “Minor Risk” in
oPBRC_UI, where the model estimates more than None existing dams and more than Frequent historic dams (oCC_EX> 1 andoCC_HPE> 5), where the departure from historic conditions is at most three dams (mCC_HisDep<= 3), and where land usage is suitably low for beavers to return (iPC_VLowLU> 75 andiPC_HighLU< 10). - Strategic - Long-term Investment is for streams that have been classified as “Negligible Risk” or “Minor Risk” in
oPBRC_UI, where the model estimates almost no existing beaver dams (0 <oCC_EX< 1) but at least Occasional historic dams (oCC_HPE>= 5), where land usage is suitably low for beavers to return (iPC_VLowLU> 75 andiPC_HighLU< 10). - Other/NA is for streams that don’t fall into the above categories. Such areas are primarily streams classified as “Considerable Risk” or “Some Risk” in
oPBRC_UI, though there are exceptions to that.
- Easiest - Low-Hanging Fruit is for streams that have been classified as “Negligible Risk” or “Minor Risk” in
-
Strategies to Promote Dam Building (
DamStrat) is an optional output that identifies possible management strategies based on existing dam building capacity, conservation/protected areas and conservation easements, observed dam locations, and land use intensity. These categories are less restrictive than the restoration or conservation opportunities, but are still a work in progress. The following color scheme is used to illustrate these distinctions: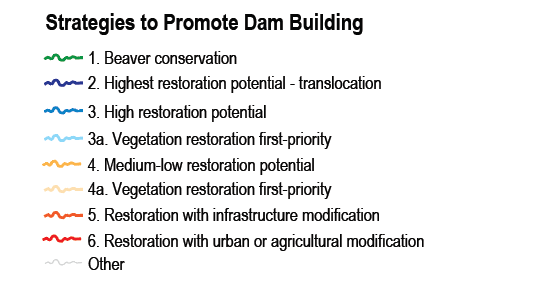
The classification is based on the following criteria:
- 1. Beaver conservation is for streams where beaver dam-building activity has already been observed and land use intensity is low (i.e., not urban or agriculture -
iPC_LU= 0). - 2. Highest restoration potential - translocation is for streams within conservation/protected areas (
ConsArea= 1) or conservation easements (ConsEase= 1) where existing dam building capacity is at least 20 dams/km (oCC_EX>= 20) - 3. High restoration potential is for streams where existing dam building capacity is at least frequent (
oCC_EX>= 5), departure from historic vegetation dam building capacity is low (oVC_HPE-oVC_EX< 4), and land use is not urban (iPC_LU<= 0.66) - 3a. Vegetation restoration first-priority is for streams where existing dam building capacity is at least frequent (
oCC_EX>= 5), departure from historic vegetation dam building capacity is high (oVC_HPE-oVC_EX>= 4), and land use is not urban (iPC_LU<= 0.66) - 4. Medium-low restoration potential is for streams where existing dam building capacity is occasional (1 <=
oCC_EX<5), departure from historic vegetation dam building capacity is low (oVC_HPE-oVC_EX< 4), and land use is not urban (iPC_LU<= 0.66) - 4a. Vegetation restoration first-priority is for streams where existing dam building capacity is occasional (1 <=
oCC_EX<5), departure from historic vegetation dam building capacity is high (oVC_HPE-oVC_EX>= 4), and land use is not urban (iPC_LU<= 0.66) - 5. Restoration with infrastructure modification is for streams where existing dam building capacity is at least occasional (
oCC_EX>=1) and the nearest infrastructure is within 30 meters (oPC_Dist<= 30) - 6. Restoration with urban or agricultural modification is for streams where existing dam building capacity is at least occasional (
oCC_EX>= 1) and land use is urban or agricultural (iPC_LU>= 0.33) - Other is for any streams that do not fall into the above categories (i.e., existing dam building capacity is rare or none -
oCC_EX< 1)
- 1. Beaver conservation is for streams where beaver dam-building activity has already been observed and land use intensity is low (i.e., not urban or agriculture -
Validation Layers
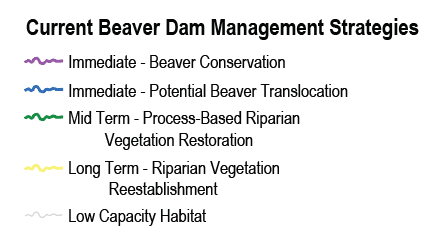
- Current Beaver Dam Management Strategies (
ConsVRest) gives specific management strategies based on the restoration or conservation categories and surveyed dam density. “Low Hanging Fruit” areas are identified as “Immediate - Beaver Conservation” if surveyed dam density is at least 25% of predicted existing capacity and “Immediate - Potential Beaver Translocation” if surveyed dam density is less than 25% of predicted capacity, “Quick Return” areas are identified as “Mid Term - Process-based Riparian Vegetation Restoration”, “Long-Term Investment” areas are identified as “Long Term - Riparian Vegetation Reestablishment”, and “Other” areas are identified as “Low Capacity Habitat”.
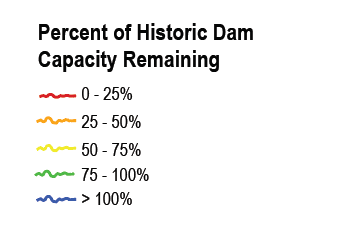
- Percent of Historic Dam Capacity Remaining (
mCC_EXvHPE) is calculated by dividing the existing dam building capacity by the historic dam building capacity.
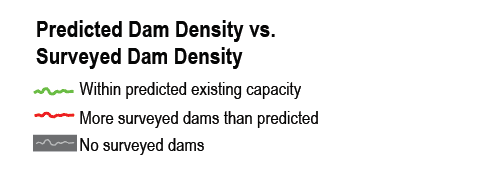
- Predicted Dam Density vs. Surveyed Dam Density (
BRATvSurv) is calculated by dividing the predicted existing capacity dam count by the surveyed dam capacity dam count. Dam counts were used rather than density to account for short segment lengths which could lead to overpredicted surveyed dam density.
Attribute Field Descriptions
Because shapefile field names are limited to ten characters, there is a limit to how descriptive those names can be. Below is a screen capture of the lookup table that describes what the attribute field names within the shapefiles, Layer Packages and KMZs corresponds to. The actual lookup table can be found here for closer inspection and a glossary of all current pyBRAT values can be found here.

Visualizing BRAT Outputs
Web GIS Portal on DataBasin
If you are not a GIS user and you either don’t have or don’t want to install Google Earth Desktop, you can visualize the results in an interactive WebGIS Browser on DataBasin (currently only for Utah).
Google Earth
If you want to browse around the BRAT outputs in Google Earth, you can download KMZ files from our data repository and virtually fly away.
ArcGIS
If you have access to ArcGIS and are comfortable getting around in ArcGIS, this video shows you how to download the shapefiles and layer files and visualize them in ArcGIS.
Looking further into working with BRAT layer packages for interrogation and visualization.
Queries in ArcGIS
If you want to interrogate the BRAT results and run queries to summarize them in more useful ways for your areas of interest, this video shows you how (warning > 20 minutes).
 Back to BRAT Home